Sample Dashboard
Coffee Shop Dashboard
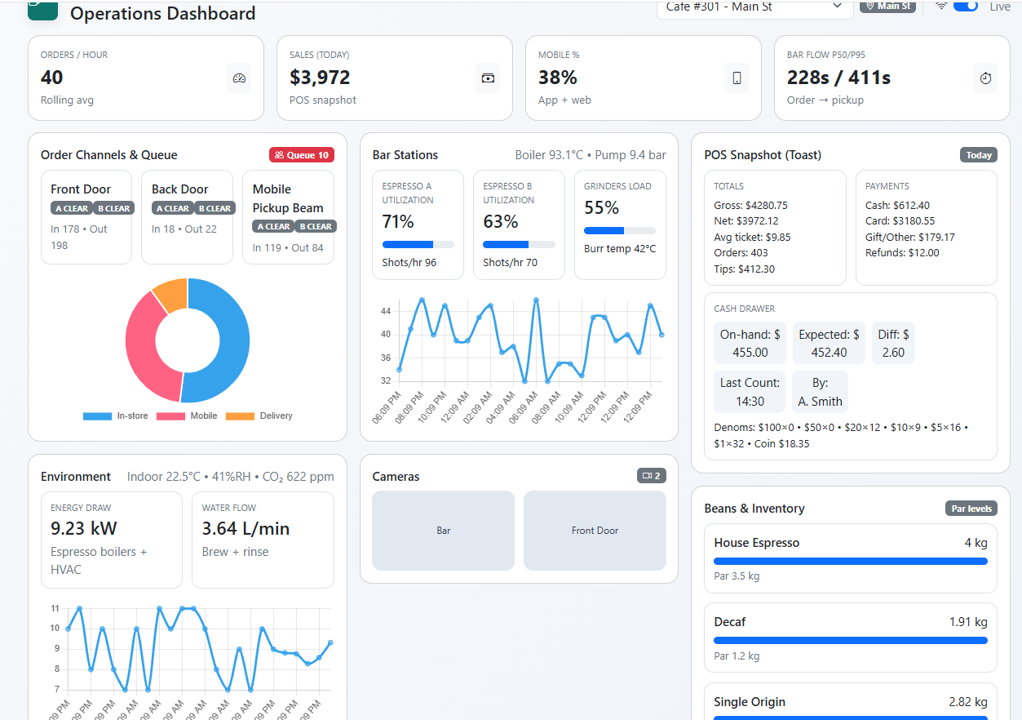
Monitor customer traffic, occupancy, environmental conditions, equipment status and daily operating trends.
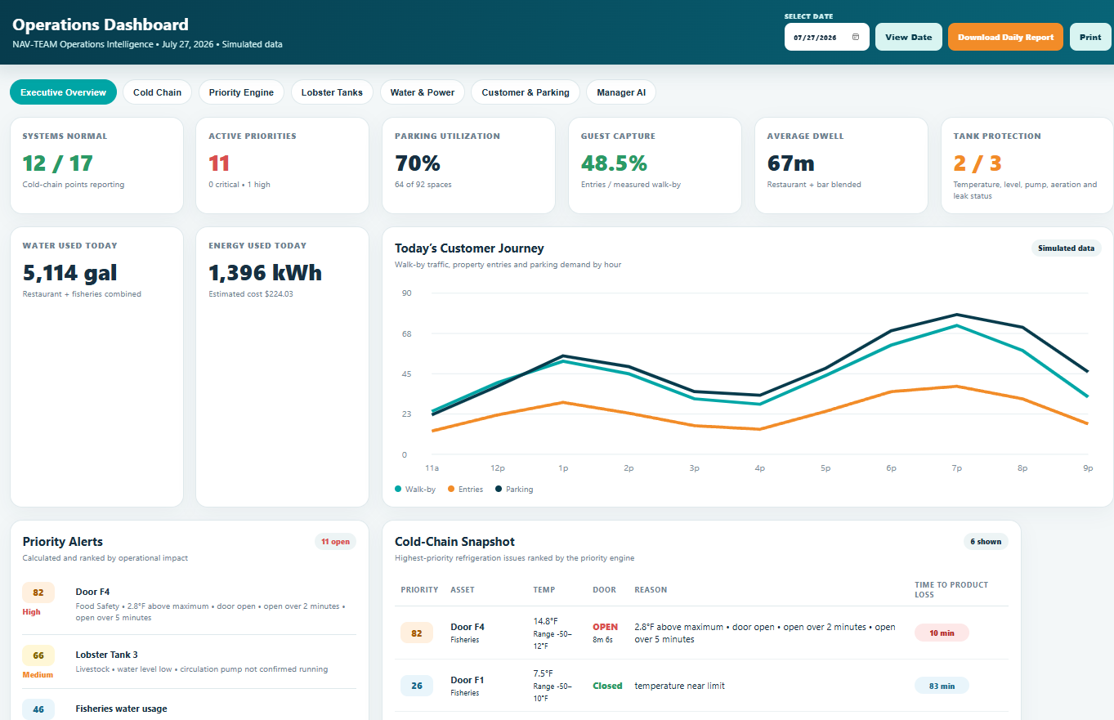
NAV Team dashboards combine sensor data, operational metrics, alerts, trends and reporting into interfaces designed around the way your organization works.
Select any dashboard below to open the working sample in a new browser tab.
Sample Dashboard
Monitor customer traffic, occupancy, environmental conditions, equipment status and daily operating trends.
Sample Dashboard
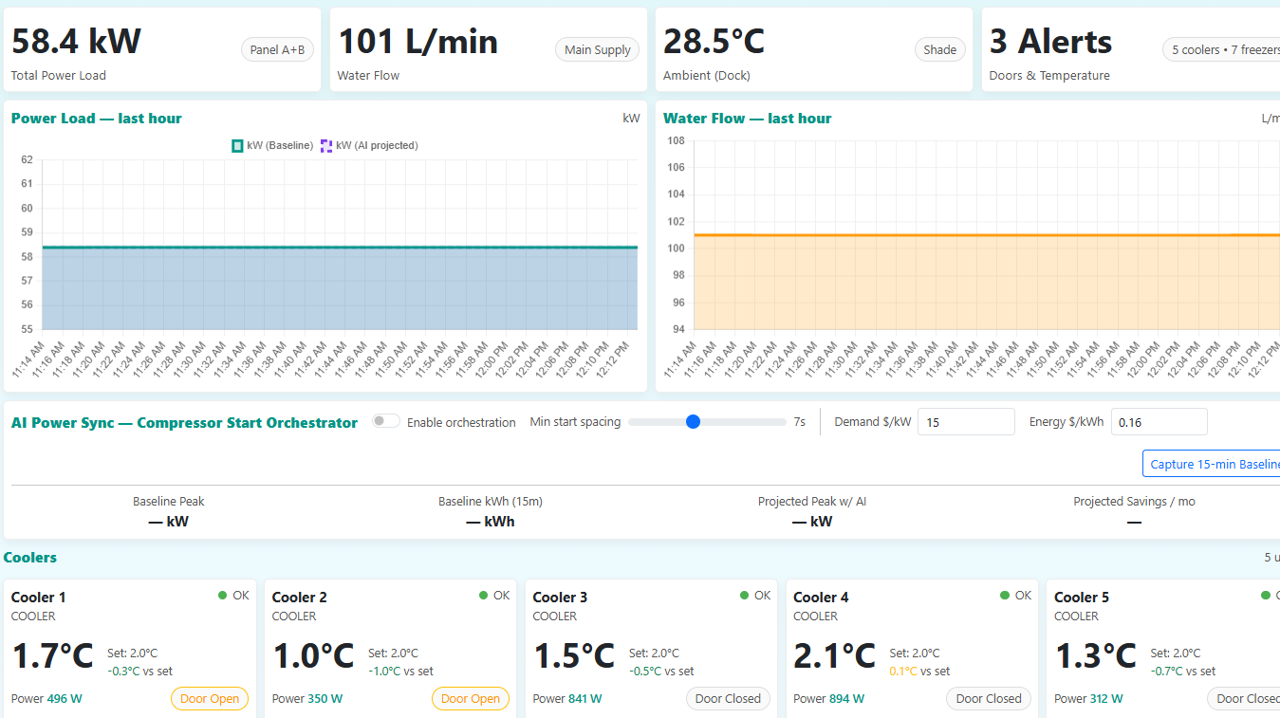
Track cooler and freezer temperatures, door activity, alarms, recovery time and cold-chain performance.
Sample Dashboard
Review multiple storage zones, equipment health, temperature exceptions and operational response information.
Sample Dashboard
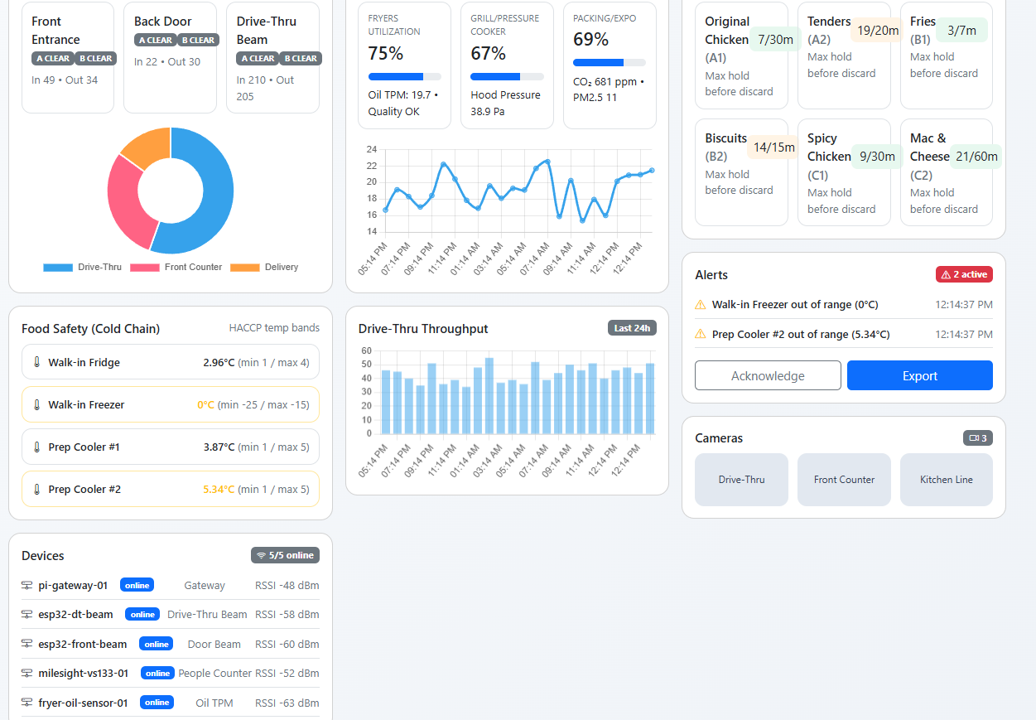
Combine customer traffic, refrigeration, food-preparation environments, equipment and operational performance.
Sample Dashboard
Measure entrance activity, customer engagement, traffic patterns and the performance of first-impression areas.
Sample Dashboard
Monitor generator status, battery condition, fuel, runtime, maintenance indicators and critical alarms.
Sample Dashboard
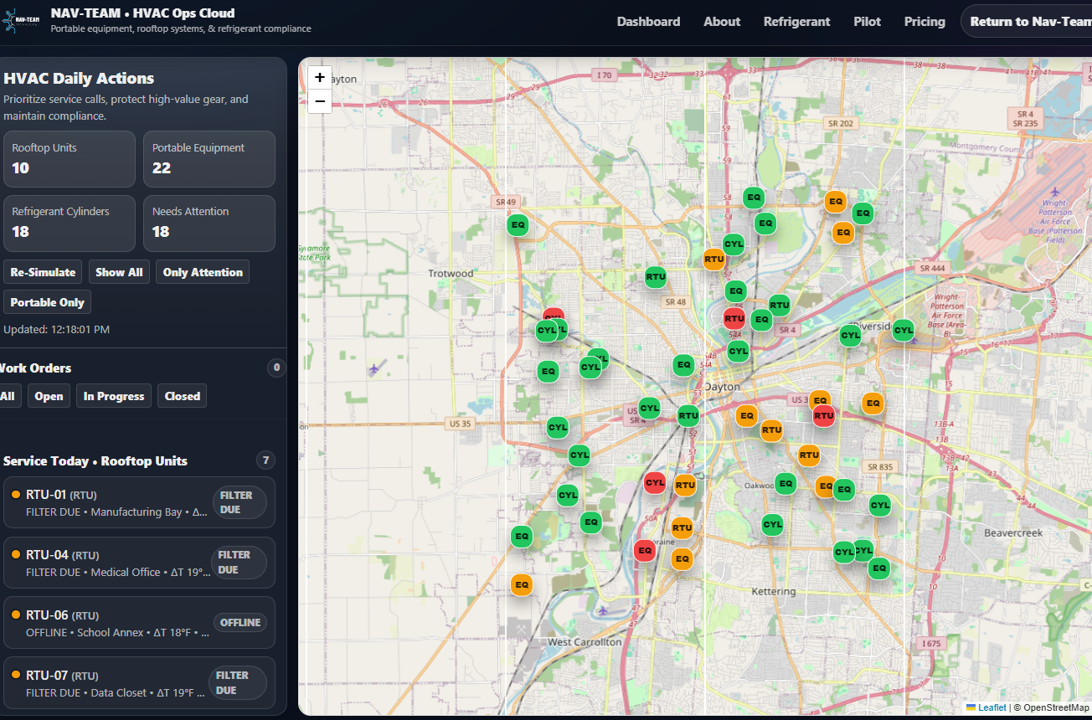
Track temperatures, humidity, equipment status, energy use and HVAC performance across one or more locations.
Sample Dashboard
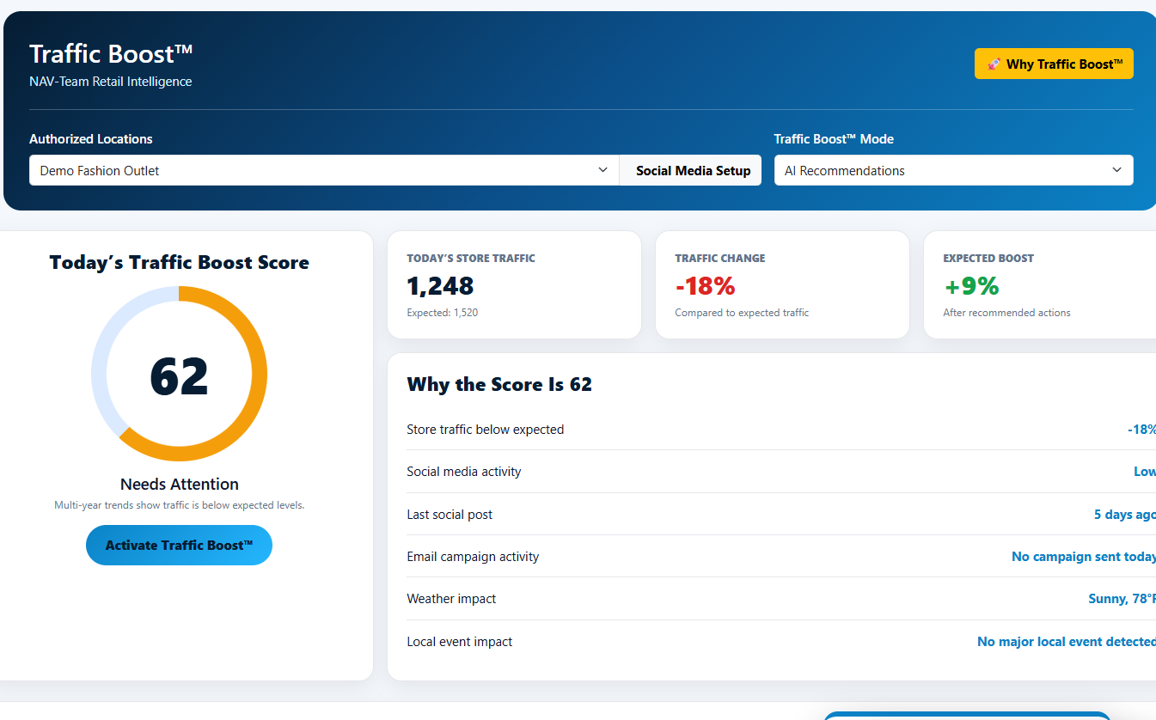
Compare store traffic, entrances, conversion opportunities, daily trends and multi-location performance.
Sample Dashboard
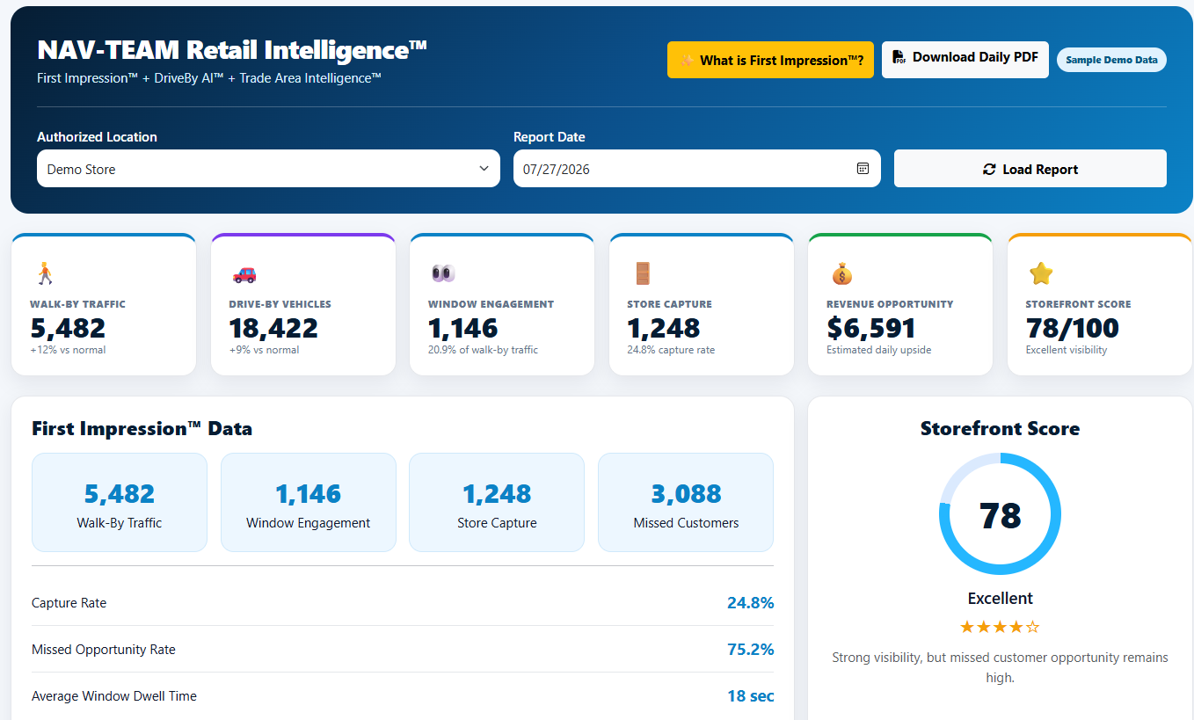
Measure walk-by traffic, storefront engagement, visitor capture and campaign performance.
Sample Dashboard
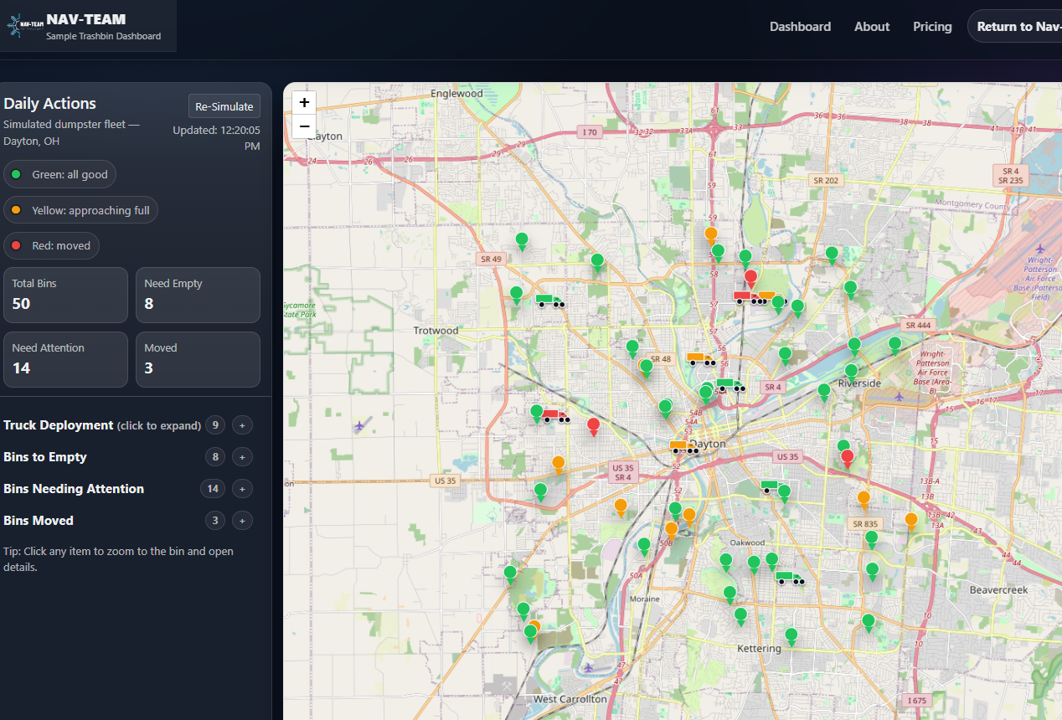
Monitor fill levels, collection priorities, service history and route-planning opportunities.
NAV Team dashboards can be licensed as configured solutions or easily customized for your branding, users, sensors, workflows and reporting requirements. They can utilize API connections and SQL-type databases to bring information from multiple systems into one interface.
Tell us what information you collect, where it is currently stored and what your team needs to see, compare, report or act on.